
The Greatest Threats of Climate Change Have Become Reality
Infectious disease vectors, violent rain, and deadly humid heat now stand among the greatest threats of climate change, no longer future warnings but present realities. This deadly triad -- rising infectious diseases, escalating heat extremes, and intense rainfall events -- has begun driving an exponential increase in climate-related deaths worldwide. These hazards do not operate in isolation; they amplify one another's impacts, creating cascading risks that strain health systems, destabilize communities, and accelerate global mortality. Climate change has become a full-scale health crisis, demanding urgent, systemic action before these accelerating threats overwhelm society's ability to respond.
Violent Rain: A New Climate Reality
My interest in sea-level rise and ice sheets collapsing began in the 1990's after I asked Sidd his greatest concerns about human induced climate change. Much of climate change can be reversed or at least stopped from worsening. The collapse of ice sheets is irreversible. Sidd said, "A terrible future awaited." Coastal areas were forecast to be at greatest risk.
By 2020, I had become just as concerned about the rise in sea levels being transported inland. Both the sea and air temperatures are rising. Warm air can hold more moisture than cool air. Warmer sea temperatures result in more evaporation. The increased moisture in the air moves over land causing inland deluges.
In October of 2023 Sidd said, "Now I am thinking the violent rain will be a bigger problem before we die... still thinking it through. In the long run, ya, sea level rise will hit big. If you look at the history, it is episodic, and in the fast bits it can go up 3 feet every twenty years for five hundred years. But, the rain intensity is increasing faster today, and drainage cannot cope, whether in the city or out, culverts and such put in over the last hundred years cannot handle. So, I am paying a lot of attention to terrain and drainage far inland from the seacoast (like Ohio.) By drainage I don't mean just human built. I mean that the natural streams and gullies and ravines have not evolved to a state that can handle the water volumes we see and the worse, larger volumes we will see. So expect huger erosion, steeper slopes to waterways, land collapses and such. Build out your drainage."
Multiple factors drive the physics of violent rain, starting with the moisture content of the air.
As the Earth warms, warmer air can physically hold more water than cooler air. For every 1°C (1.8°F) increase in temperature, the atmosphere can hold about 7% more moisture, increasing the potential for heavy rainfall. Over a 10°C increase, this capacity nearly doubles, amplifying the intensity and frequency of extreme rain events.
One physical result of warming is the formation of larger raindrops, as well as an increase in the number of raindrops falling per square foot. Momentum of Rain is defined by the equation p = mv (where p = momentum, m = mass, and v = velocity). As raindrop mass increases, so does momentum, and part of this increasing momentum transfers to the air, intensifying wind turbulence and updrafts. Most momentum, however, is transferred upon impact, which you may notice as rain bouncing higher off streets and sidewalks. Flowing rainwater will also carry greater mass and velocity, increasing the destructive power of runoff.
On the ground, concrete, asphalt, solar panels, roofs, plants, animals, homes, and infrastructure are all struck with greater force as rain momentum rises.
Mass and velocity are part of a larger equation that includes density. Together, these variables increase the intensity of flow forces (flow dynamics). Wind and water flow forces scale with the square of velocity (v²). As flow speeds increase -- due to heavier rain or more intense heating -- damage scales as the square of that increase.
According to drag physics, force is proportional to density multiplied by the square of velocity (v²). For example:
Density further multiplies this force. Water is about 800 times denser than air, so a 10 mph flow of water exerts 800 times the force of a 10 mph wind. As flow velocities increase due to climate change, the resulting forces and damage scale exponentially. While the exact rate of velocity increases with climate change remains under study, we are already seeing the impacts as flood systems fail, sewage systems overflow, and hillsides collapse under the amplified force of violent rain and runoff.
In just ten days during July 2025, hundreds of flash floods swept across the United States, inundating communities from coast to coast, leaving hundreds dead and causing billions of dollars in damage. At least five "1-in-1,000-year" rainfall events -- storms with just a 0.1% chance of occurring in any given year under past climate conditions -- struck Texas, New Mexico, North Carolina, Florida, and Illinois. Meanwhile, Pennsylvania, Delaware, New Jersey, Maryland, Virginia, and Iowa reported multiple "500-year" floods as extreme rainfall overwhelmed infrastructure across much of the country.
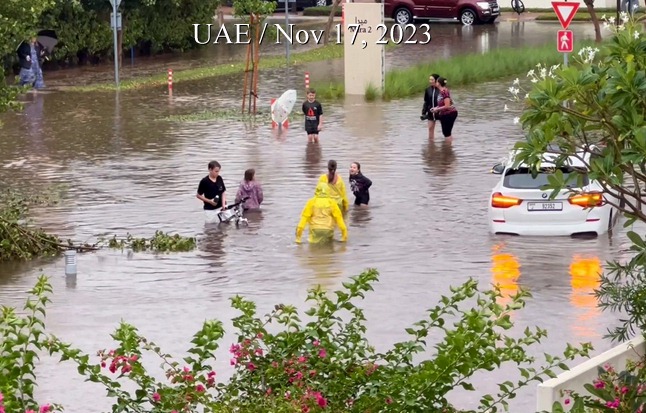
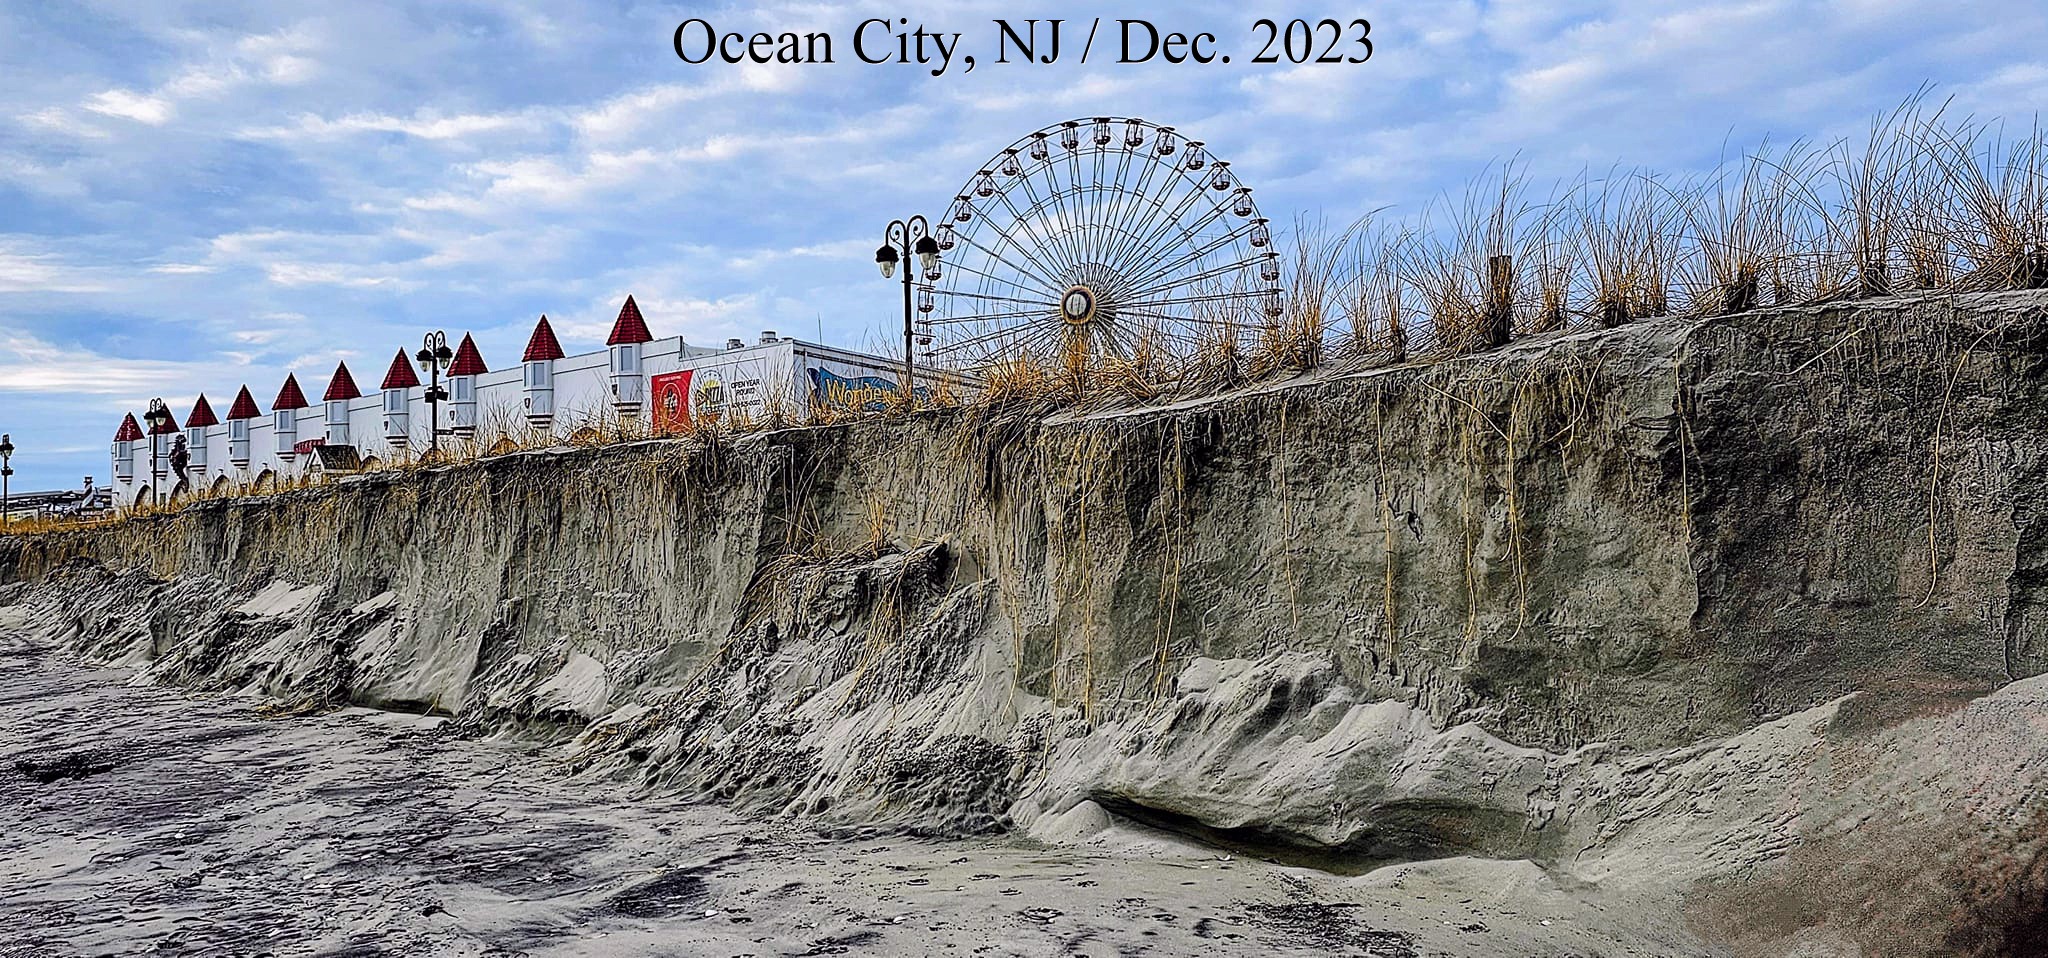
Expect to see increasing intensity and/or frequency in a wide variety of violent rain events including: downpours, flooding, hurricanes, cyclones, monsoons, coastal flooding, storm surges, lightning and wildfires, hail, extreme wind, and concurrent extremes. The reign of violent rain has already begun. More hillsides and shorelines are collapsing. Atmospheric rivers are dramatically increasing flash flooding in the Northeastern USA (pictured beach erosion in Ocean City, NJ / December 2023). Worldwide, stormwater systems are becoming overwhelmed. Ironically, the streets of Abu Dhabi and Dubai, UAE, flooded days before the COP28 Climate Conference (pictured / November 2023). Nowhere is safe from violent rain, not even in the desert preparing for a UN meeting on the climate crisis. As a result of increasing violent rain, new drainage culverts are forming. Eventually, the culverts will transform into recurring streams, carving new canyons, creating new landscapes and islands. In addition, extreme weather events are increasing the frequency of lightning storms and wildfires. After wildfires, rain deluges cause massive landslides transforming the topography. At the same time as the violent rain makes its way to the sea, the sea is rising to meet the violent rain.
You can imagine Eastern and Western North America as vast beaches with increasingly frequent atmospheric waves crashing down upon us. The Gulf Coast, in particular, will face impacts from both directions.
The atmospheric rivers also bring heavy rainfall inland causing extreme flooding. In October of 2021 NOAA said, "a convergence of storms brought more than half a foot of rain to parts of the Bay area in addition to strong winds, flash floods, and mud/landslides. They also bring the potential for heavy snow to higher elevations in the Sierra Nevada mountain range." (Atmospheric River Hits the West Coast)
Western North America
In December 2022 and January 2023, California experienced nine back-to-back atmospheric rivers; the longest stretch of continuous atmospheric river conditions on record. NOAA went on to report, "Several atmospheric rivers struck in March 2023, bringing heavy rain and snowfall to much of the West. According to the California Department of Water Resources, the statewide snowpack was among the deepest ever recorded for the end of March -- 237% of normal."
In October of 2023, a tropical storm turned into category 5 Hurricane Otis in a record 12-hour intensification. Hurricane expert Kerry Emanual said Otis was supercharged by global warming. Historically, hurricanes' intensification was driven by ocean surface temperatures. Otis was additionally supercharged by increasing temperatures deeper in the ocean. Hurricane Otis became the strongest on record to hit Mexico's Pacific coast. NOAA reported, "When Otis first hit, mudslides outside the city in mountainous terrain prevented crews from traveling to the city to provide aid, and according to the Associated Press, the 10,000 troops that were deployed to the area lacked the tools needed to clear mud and downed trees off roads."
Eastern North America
The Eastern US is already seeing violent rain events as far inland as Kentucky with historic flooding in both 2022 and 2023. Eastern Canada has experienced its worst hurricanes on record. Florida, South Carolina, and North Carolina have suffered billions of dollars in storm damage. Homeowners insurance is becoming
increasing difficult to obtain in Florida.
There is increasing research into the types and intensification of East Coast AR events.
The US Fourth National Climate Assessment highlights a substantial increase in heavy precipitation events in the Northeast, with ongoing projections indicating further rises in precipitation, notably during winter and spring and in northern areas of the region.
Traditionally, atmospheric rivers (AR) in the United States have been linked to the West Coast. However, there is now growing recognition of AR activity on the East Coast. "In reality, their frequency hasn't necessarily increased. Meteorologists have been using the term for decades; it's simply gained popularity in the media, much like the polar vortex," explained Jeff Boyne, meteorologist and climatologist at the National Weather Service. Indeed, according to Jason Cordeira, associate professor of meteorology at Plymouth State University, "Atmospheric rivers are more common on the East Coast than on the West Coast, although they tend to be less impactful and produce lower rainfall amounts."
In March 2024, NOAA and the National Weather Service finally recognized the heightened frequency of East Coast Atmospheric Rivers occurrences, attributing them primarily to the recent shifts in the Pacific/North America (PNA) teleconnection pattern. This shift is accompanied by a northward movement of the midlatitude jet stream. ARs in the Eastern US have received relatively little attention despite their frequent occurrence and significant impact on heavy precipitation and severe weather events. The authors conducted a comprehensive study on wintertime AR frequency over the Eastern US spanning four decades, utilizing multiple observations and a state-of-the-art high-resolution climate model (AM4) developed at GFDL. Their findings reveal a notable rise in AR frequency over the Eastern US during this timeframe. NOAA's report reaffirmed these findings, emphasizing the confirmed linkages with the PNA pattern across diverse scenarios, highlighting the crucial role of the PNA pattern in influencing AR variability.
Many types of East Coast ARs are intensifying, likely as a result of climate change. A study titled "Identifying Eastern US Atmospheric River Types and Evaluating Historical Trends" notes, "The increased moisture transport could have significant implications across the northeast corridor from Washington D.C. to Coastal Maine, heightening the risk of extreme precipitation from landfalling ARs. The study reveals that most ARs in the region are induced by extratropical cyclones, with lee side low pressure systems and coastal lows along the Atlantic Coast (e.g., nor'easters) being responsible for generating the strongest ARs."
Climate change is anticipated to bring complex and potentially substantial impacts to both the Atlantic Meridional Overturning Circulation (AMOC) and atmospheric rivers along the East Coast of the USA. The AMOC interacts with atmospheric circulation patterns, including the positioning of the jet stream. Changes in the AMOC can influence the behavior of the jet stream, which, in turn, affects the formation and path of atmospheric rivers. The jet stream plays a crucial role in steering weather systems and atmospheric rivers.
How Fast Are Atmospheric Rivers Gaining Frequency and Intensity?
While the rate of change in the intensity, duration, and likelihood of climate disasters varies depending on the type of extreme weather, insights from events like the Canada wildfires of 2023 offer valuable perspective. According to the World Weather Attribution Organization, "Climate change amplified the cumulative severity of Quebec's 2023 fire season up to the end of July by approximately 50%, and seasons of this severity are now at least seven times more likely to occur." Similar trends may be observed in other catastrophic events such as hurricanes, heatwaves, droughts, floods, tornadoes, sea level rise, and atmospheric rivers.
According to a NASA-led analysis, global average sea level rose by approximately 0.3 inches (0.76 centimeters) from 2022 to 2023. When our paper, “Climate Change: Rate of Acceleration,“ was authored in 2023, the swift acceleration of this trend was unforeseen. Initially projected to double over 100 years, the rate of sea level rise dramatically escalated, shortening the doubling period to just 10 years by 2020. Recent observations suggest a further compression of this doubling period to a mere 2 years, raising significant concerns. It is imperative to acknowledge and address this alarming trend, hoping it is not indicative of a new norm but rather an anomaly.
Some areas of the world are now warming so fast, it is becoming more difficult to measure the change from "normal" or average. Jeff Boyne of the NWS said, "There are climate normals that are updated every 10 to 15 years, because the planet is warming so fast. The ENSO (El Nino-Southern Oscillation) regions are warming so fast that those normals are being updated every 5 years." "It's so far outside anything we've seen, it's almost mind-blowing," says Walter Meier, who monitors sea-ice with the National Snow and Ice Data Center. "September was, in my professional opinion as a climate scientist, absolutely gobsmackingly bananas," said Zeke Hausfather, at the Berkeley Earth climate data project."

Hurricane Ida in the summer of 2021 is a good example. Because of the 85 degrees Fahrenheit Gulf of Mexico ocean temperature, Ida rapidly gained strength right before it made landfall jumping from a Category 1 to a Category 4 storm. The warm air allowed more moisture to be carried as rain. The storm was so large that it was able to pick up more moisture from the Atlantic Ocean. After destroying parts of Florida, the ocean moisture was carried inland and dumped over places like Pennsylvania and New York. Ida caused record flood damage in parts of Pennsylvania. The Philadelphia Inquirer reported, "The remnants of Hurricane Ida destroyed or damaged hundreds of homes in Southeastern Pennsylvania and caused more than $100 million in public infrastructure damage across the state." There were more deaths in the Northeastern USA than where the storm made landfall in Louisiana. The New York Times reported, "The remnants of Hurricane Ida caused flash flooding and a number of deaths and disrupted transit across parts of New York and New Jersey. The storm killed at least 43 people in New York, New Jersey, Pennsylvania and Connecticut and left more than 150,000 homes without power." Ida's Philadelphia area destruction included 5 deaths, 7 tornadoes, record flooding, hundreds of water rescues, and "one incredibly soggy mess." The violent rain in Philadelphia was so extreme that the main road across the city from the Delaware River to the Schuylkill River, the Vine Street Expressway, was turned into a canal. "You could've swam from 22nd Street to about 15th Street," said Justin Galbreath, a district maintenance manager at the Pennsylvania Department of Transportation. As climate change intensifies, the frequency of Vine Street becoming a river will likely increase until such time as it becomes permanent.
The train derailment in Plymouth Meeting (July 17, 2023), the eleven vehicles swept away, and the seven people drowned by flood waters in Washington Crossing (July 15, 2023) were caused by a deluge of rain and flash flooding. "In my 44 years, I've never seen anything like it," Upper Makefield Fire Chief Tim Brewer said. "When the water came up, it came up very swiftly. We do not think that anybody drove into it, that they were actively on that road when it happened." CBS news reported, "Over 6 inches of rain in an hour caused the flash flooding according to Brewer. The fire department was dispatched in that area for a lightning strike and just by happenstance they found 11 cars. Eight people were rescued from the cars and two from the creek." In July and December of 2023, extreme rainfall resulted in sinkholes being exposed in the carbonate rock under Route 202 in nearby King of Prussia, PA.
In September of 2023, the Philadelphia Inquirer reported, "The remnants of Tropical Storm Ophelia soaked the entire Philadelphia region with episodic downpours on Saturday, the first day of fall, conspiring to incite 60-mph wind gusts at the Shore and high-tide flooding that closed numerous roads in beach and back-bay towns." There were up to 8 inches of rain recorded throughout the Philadelphia region over the three day event.
The winter of 2023 saw near weekly atmospheric river flash flooding events. On January 9, the Greater Philadelphia Region incurred an historic winter tropical violent rain event. CBS news reported, "If it feels like it's been an abnormally rainy few weeks, you're right. Normal rainfall totals between Dec. 1 and Jan. 9 amount to about 4.78 inches. Between December 2023 and Tuesday, we'd already recorded more than 9 inches of rain, an amount normally recorded in December, January and February combined." The January 9 storm brought over 4 inches of rain to many areas. The Delaware River peaked at its highest level ever. There were hurricane strength winds with wind gusts over 70mph.
On March 23, 2024, Philadelphia witnessed its wettest March day on record. The rain gauge at the airport measured over 3 inches of rainfall, with parts of New Castle County, Delaware, also receiving over 3 inches. Some areas in Gloucester County and Camden County, New Jersey, recorded rainfall exceeding 4 inches. The precipitation observed on that day was roughly equivalent to the typical rainfall for the entire month. A young girl was swept away by the rapidly rising and swift moving waters of the Chester Creek in Delaware County, PA. On the same day, an atmospheric river event brought heavy rains to Brazil's Rio de Janeiro state, resulting in at least nine fatalities, with Petropolis being the hardest hit. A staggering 270 mm (11 inches) of rain fell within 24 hours, significantly impacting the region and leading to numerous incidents, including landslides and house collapses.
Between April 1 and 4, 2024, Southeastern Pennsylvania experienced another severe weather event attributed to atmospheric rivers and strong winds. Rainfall accumulation exceeded 3 inches, accompanied by wind gusts ranging from 35 to 45 mph. Tragically, two individuals lost their lives in unrelated incidents, one in Montgomery County and the other in Delaware County, when trees collapsed onto their vehicles. Blue Marsh State Park had to shut down when the lake unexpectedly rose by nine feet overnight.
Conclusion
Humans are making the Earth hotter. The cool water from the melting ice at the poles is being drawn toward the center of the Earth and getting warmed to record high temperatures. The warm, moist air is circulating and moving over land. The average time
moisture stays in the air is 9 days before it turns into precipitation.
The warmer the air becomes, the more rain the atmosphere holds and dumps; therefore, violent rain events are increasing in frequency and intensity.
The greatest short term risk to the Earth is violent rain (liquefied water vapor). The greatest short term risk to human health is deadly humid heat (hot water vapor).
* Our climate model employs chaos theory to comprehensively consider human impacts and projects a potential global average temperature increase of 9℃ above pre-industrial levels.
ALSO SEE:
Elegant and Dangerous Mathematics: Turning Ordinary Storms Into Catastrophic Events / Brouse and Mukherjee (2025)
The Physics of Violent Rain / Brouse and Mukherjee (2024)
Violent Raindrops: Raindrops Are Increasing in Size / Brouse and Mukherjee (2024)
How is All Real Estate at Risk From Climate Change? / Brouse and Mukherjee (2024)
Flood Insurance / Brouse and Mukherjee (1995-present)
Hydroclimate Whiplash: America's Flood Disaster Signals Accelerating Climate Chaos Brouse (2025)
1,000-Year Flood Hits Chapel Hill: Another Warning Sign of a Warming World Brouse (2025)
Florida’s Real Estate Collapse: Climate Physics, Soaring Costs, and the End of Coastal Wealth Brouse (2025)
Texas Flood Disaster: 500-Year Floods Become Regular Events Brouse (2025)
The Converging Collapse: AMOC, Jet Streams, and Deadly Wet-Bulb Temperatures Brouse (2025)
Polar Vortex Disruptions, Rossby Waves, and a New Threats to the Stratosphere: Why Our Jet Streams Are Becoming Unrecognizable Brouse (2025)
The Philadelphia Experiment: a Study on the Reign of Violent Rain Brouse (2024)
Violent Rain and the Substrate
Climate Change, the Jet Stream, and East Coast Atmospheric Rivers
Climate Change: Rate of Acceleration
Climate Change: How Long Is "Ever"?