TOPEX, JASON satellite measurements of Sea Level Rise
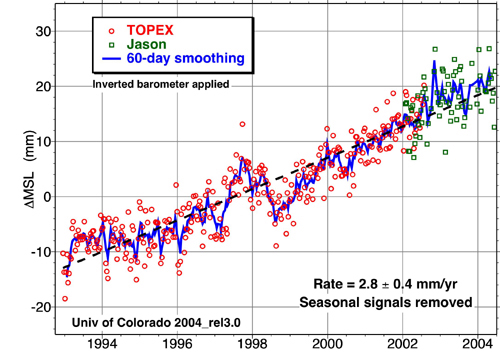
The picture above is from the University of Colorado website at
http://sealevel.colorado.edu showing the sealevel rise over the
last dozen years. The dashed line is an average of the data
showing a mean sea level rise of 2.8+/-0.4 mm/yr.
The data is available in text form at
http://sealevel.colorado.edu/2004_rel3.0/sl_ib_cu2004_rel3.0_global.txt
Looking at the graph it seemed to me that the rate of sealevel rise
had increased since 1999. Therefore I fitted the data in four different ways,
assuming an error estimate for the individual points of 7mm.
1)a linear fit to all the data as in the colorado graph above. My results
agree with the 2.8+/-0.4mm/yr figure from University of Colorado as
I obtained 2.8+/-0.6mm/yr.
2)a linear fit to the data from 1992 to 1999. This gives a rate of
sealevel rise of 2.1+/-0.2mm/yr
3)a linear fit to the data from 1999 through 2004. This gives a rate of
sealevel rise of 3.7+/-0.2 mm/yr
4)just for fun an exponential fit to all the data: y=a*exp((x-1992)/tau)+b
This fit gave tau=11+/-2yr at the time constant tau of the exponential.
Both the linear and the exponential fits had roughly the same chi-square
indicating that the available data cannot really distinguish between a linear
increase in sea level and an exponential one. It may be of
importance that the chi-squares error estimate for rate of sea level increase
in the linear fits 2 and 3 are smaller than that in the linear fit 1
(the Colorado fit). This seems to show that the data has some preference
to being fitted with two piecewise linear sections than one straight line.
Details of all the fits are at the end of this page.
The image above is a graph including the data and the fits.The red line is
a linear fit to the data from 1992 to 1999. The green line is the University
of Colorado fit to all the data. The blue line is a linear fit to the
data from 1999 through 2004. The purple is the exponential fit to
all the data. It seems clear that the data is rising above the red line
(linear fit from 1992-1999). I have extrapolated (yes, I know, one of
the Cardinal Sins) the lines out to 2020. If the sea level continues to
rise in a linear fashion, it seems that we may expect sea level rise of
between 40 and 55 mm (1.6-2.2 in.) above present sea level in 2020.
Bearing in mind that an average beach gradient is about 1%, this
translates into shorelines moving inward by 4 to 5.5 m (13 to 18 ft.)
by 2020.
Note:the increase in the rate of sealevel may be explained
by the results from Dyurgerov which show a sharp increase in the contribution
of mountain and subpolar glaciers to sealevel rise since 1997.
(Dyurgerov, Mark. 2002. Glacier Mass Balance and Regime: Data of Measurements
and Analysis. INSTAAR Occasional Paper No. 55, ed. M. Meier and R. Armstrong.
Boulder, CO: Institute of Arctic and Alpine Research, University of Colorado.
Distributed by National Snow and Ice Data Center, Boulder, CO. A shorter
discussion is at http://nsidc.org/sotc/sea_level.html)
Greenland ice sheets are also melting faster;
a recent paper (Joughin et al, Nature 432,p608.;
http://www.spaceref.com/news/viewpr.html?pid=15611)
shows that the Jacobshavn Isbrae glacier, which drains 6% of the Greenland
icesheets has doubled in speed from 1997 to 2003.
Note added 17th Feb 2005:
The British Antarctic Survey has recently reported
quicker glacier velocities in the Antarctic Peninsula.
http://www.antarctica.ac.uk/News_and_Information/Press_Releases/story.php?id=158
Fit Details
---
I) linear fit to all data: y=m1*(x-1992)+c1
final sum of squares of residuals : 123.734
rel. change during last iteration : -6.2019e-15

degrees of freedom (ndf) : 375
rms of residuals      (stdfit) = sqrt(WSSR/ndf)      : 0.574419
variance of residuals (reduced chisquare) = WSSR/ndf : 0.329957

Final set of parameters            Asymptotic Standard Error
=======================            ==========================

m1              = 2.7742           +/- 0.06282      (2.264%)
c1              = -17.6361         +/- 0.4636       (2.629%)


correlation matrix of the fit parameters:

               m1     c1
m1              1.000
c1             -0.895  1.000
---

---
II) linear fit to data from 1992 to 1999: y=m2*(x-1992)+c2
final sum of squares of residuals : 61.8659
rel. change during last iteration : -1.31919e-06

degrees of freedom (ndf) : 199
rms of residuals      (stdfit) = sqrt(WSSR/ndf)      : 0.55757
variance of residuals (reduced chisquare) = WSSR/ndf : 0.310884

Final set of parameters            Asymptotic Standard Error
=======================            ==========================

m2              = 2.06294          +/- 0.1556       (7.543%)
c2              = -14.8879         +/- 0.6717       (4.512%)


correlation matrix of the fit parameters:

               m2     c2
m2              1.000
c2             -0.912  1.000
---

---
III) linear fit of data from 1999-2005: y=m3*(x-1992)+c3
final sum of squares of residuals : 47.8434
rel. change during last iteration : -1.59937e-08

degrees of freedom (ndf) : 174
rms of residuals      (stdfit) = sqrt(WSSR/ndf)      : 0.524368
variance of residuals (reduced chisquare) = WSSR/ndf : 0.274962

Final set of parameters            Asymptotic Standard Error
=======================            ==========================

m3              = 3.72349          +/- 0.1817       (4.879%)
c3              = -26.7349         +/- 1.775        (6.638%)


correlation matrix of the fit parameters:

               m3     c3
m3              1.000
c3             -0.988  1.000
---

---
IV) exponential fit of all data: y(x)=a*exp((x-1992)/tau)+c


final sum of squares of residuals : 111.762
rel. change during last iteration : -2.79609e-08

degrees of freedom (ndf) : 374
rms of residuals      (stdfit) = sqrt(WSSR/ndf)      : 0.546653
variance of residuals (reduced chisquare) = WSSR/ndf : 0.298829

Final set of parameters            Asymptotic Standard Error
=======================            ==========================

a               = 16.8106          +/- 4.578        (27.23%)
tau             = 11.1991          +/- 1.837        (16.4%)
b               = -30.9617         +/- 5.142        (16.61%)


correlation matrix of the fit parameters:

               a      tau    b
a               1.000
tau             0.997  1.000
b              -0.998 -0.991  1.000

---
Main Index