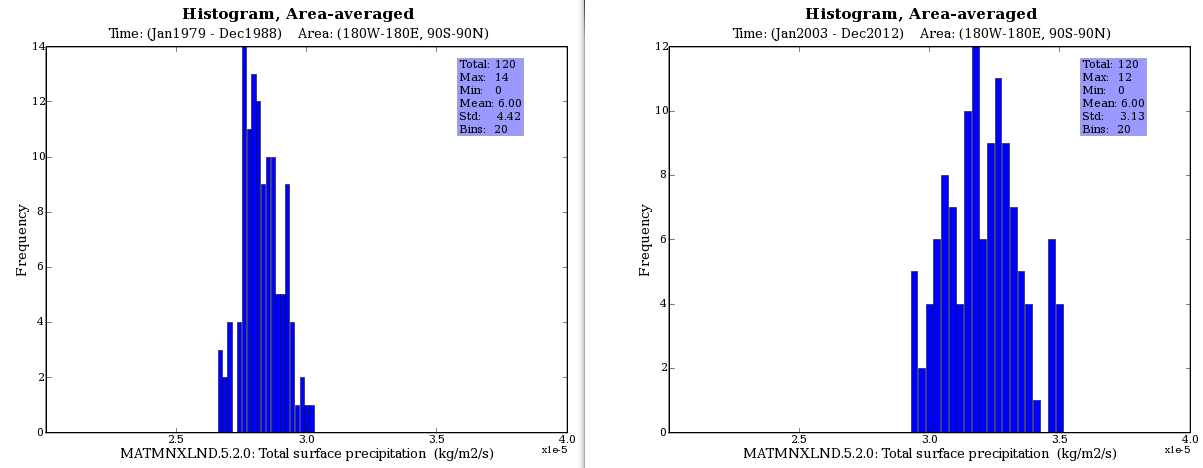
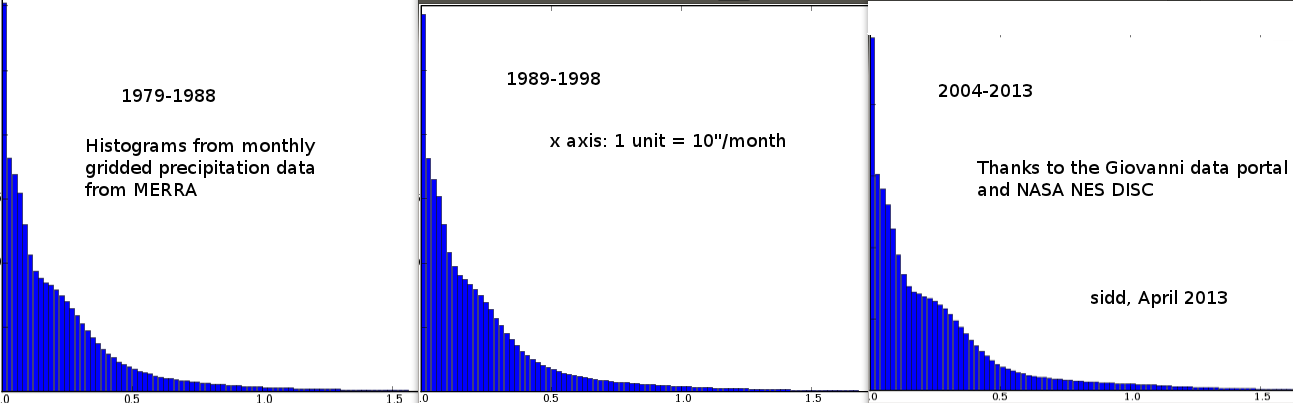
These are histograms of the monthly precipitation worldwide for 1979-1988 and 2003-2012 from MERRA, made by my new best friend, Giovanni, the data portal cared for by NASA NES DISC
The x axes units are roughly an inch a month.
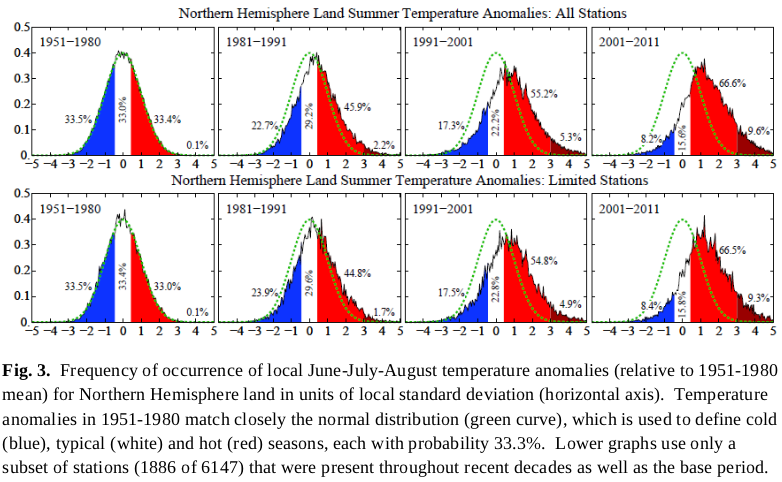
Amazing, isn't it? The distribution has broadened and shifted to the right, just like in the temperature data exhibited by Hansen in 2011 in the climate dice paper, Cimate Dice and updated at http://www.nasa.gov/pdf/719139main_2012_GISTEMP_summary.pdf
Now look at projections for the return time for 20th century 100 yr floods in the period 2071-2100 under the CMIP5 RCP8.5 scenarios. from Hirabayashi et al., Nature Climate Change, DOI:10.1038/NCLIMATE1911
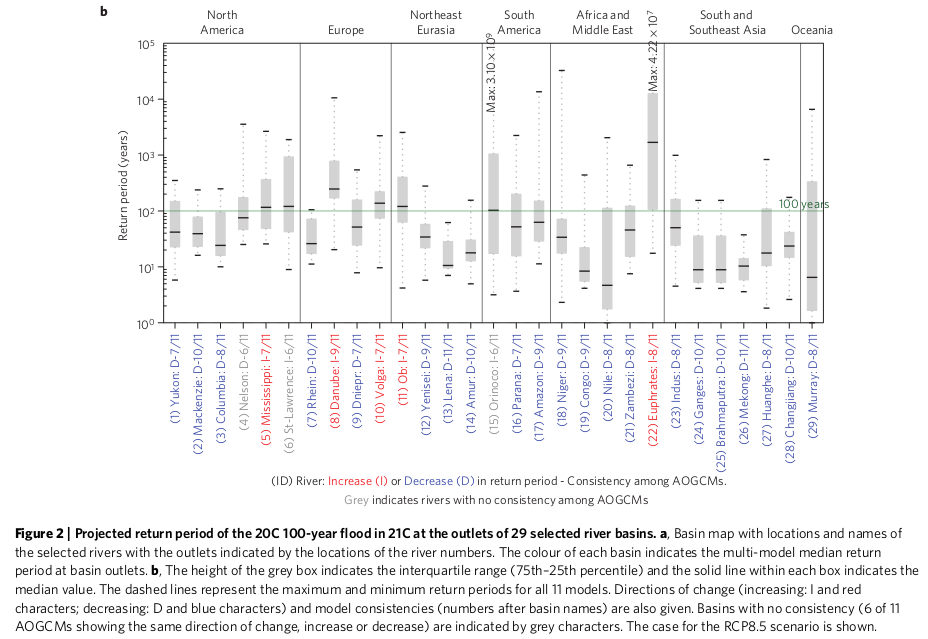
South Asia, Southeast Asia, and Africa are worst hit. The recurrence time for a twentieth century 100 yr flood drops to ten years or below for the Lena, Congo, Nile, Ganges, Brahmaputra, Mekong and Murray-Darling.
For a look at patterns in E. China, see here.