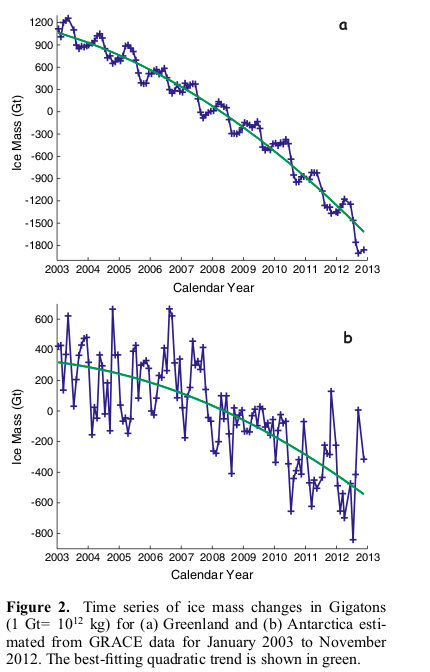
The two largest ice sheets on earth, Greenland and Antarctica,
are losing mass faster and faster. The figure below is from
Velicogna and Wahr, "Time-variable gravity observations of ice sheet mass
balance: Precision and limitations of the GRACE satellite data"
GEOPHYSICAL RESEARCH LETTERS, VOL. 40, 3055-3063, doi:10.1002/grl.50527, 2013
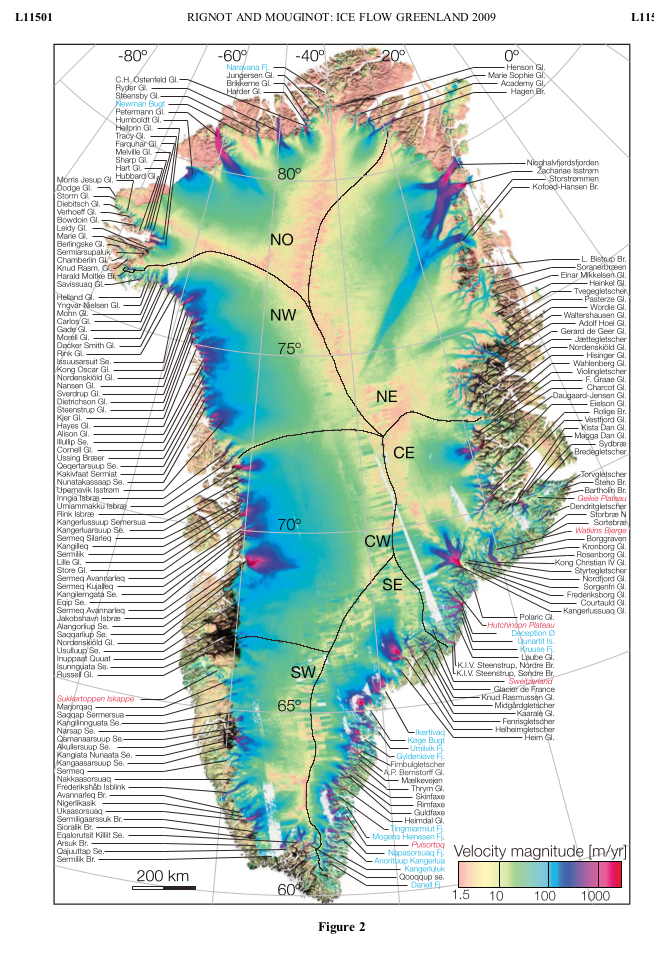
Causes of Mass Loss
I. Marine terminated glaciers flow to the ocean and calve off icebergs. The
figure below is from Rignot and Mouginot,"Ice flow in Greenland for the
International Polar Year 2008-2009," GEOPHYSICAL RESEARCH LETTERS, VOL. 39,
L11501, doi:10.1029/2012GL051634, 2012
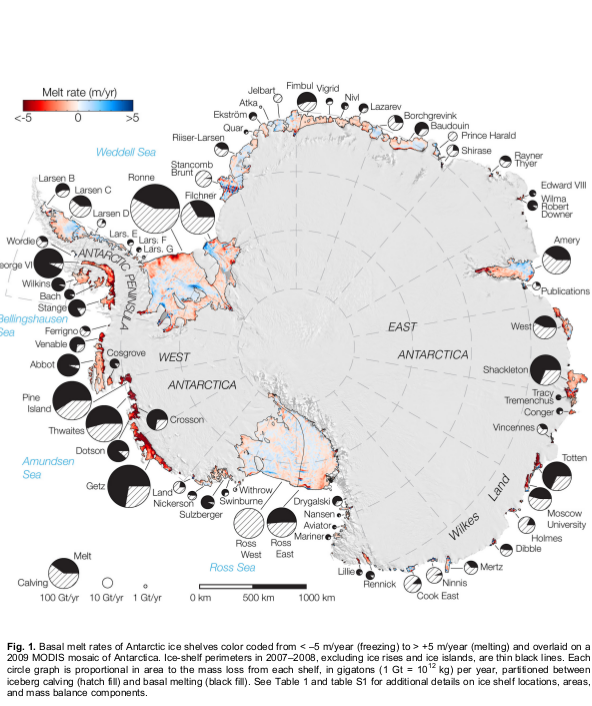
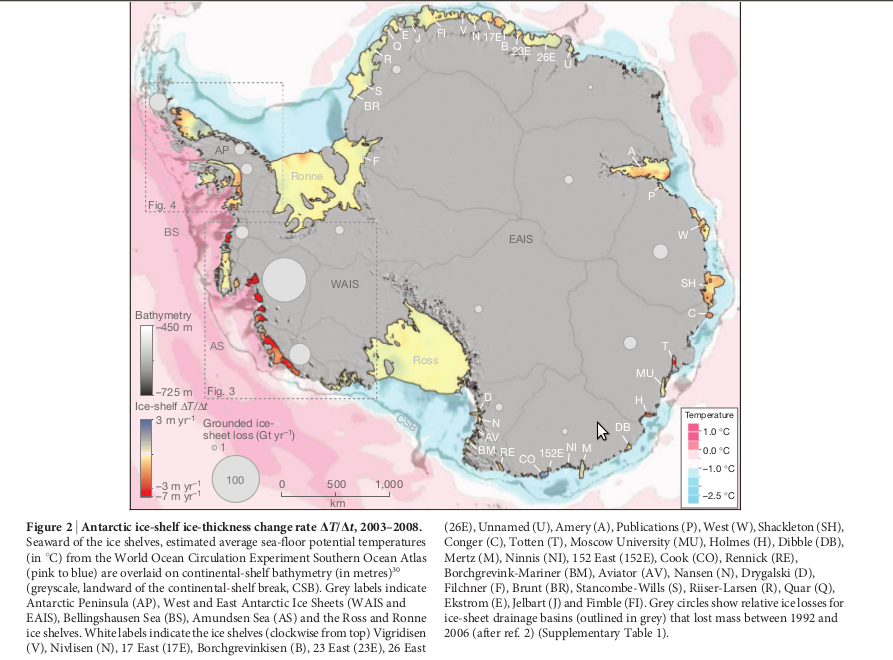
II. Warmer ocean waters melt ice shelves at their bases. I show Fig 1 from
Rignot et al.,"Ice Shelf Melting Around Antarctica," Science Express,
13th June 2013, doi:10.1126/science.1235798
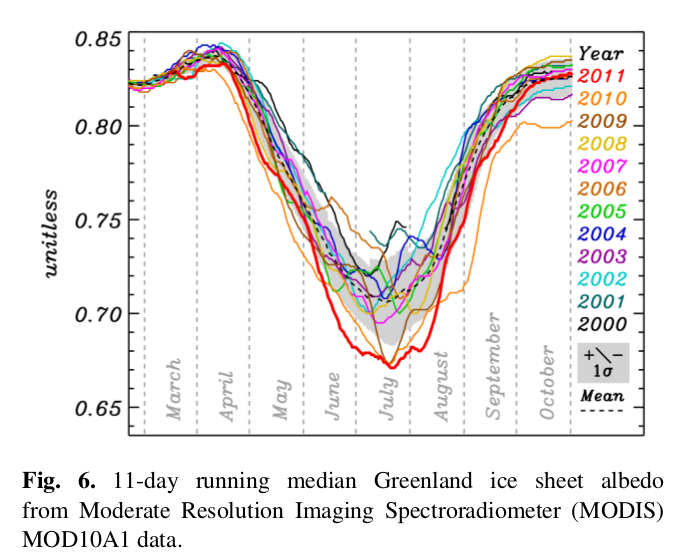
III. Darker snow surfaces absorb more sunlight and melt quicker.
This effect is visible in Greenland. Box et al.,"Greenland ice sheet
albedo feedback: thermodynamics and atmospheric drivers," The Cryosphere,
v6, pp821 et seq., doi:10.5194/tc-6-821-2012 state: " Thus, intraseasonal
summer albedo variability exceeds 0.50 over parts of the ice sheet where
a snow layer ablates by mid-summer, exposing an impurity-rich ice
surface ..." I reproduce Fig. 6 below
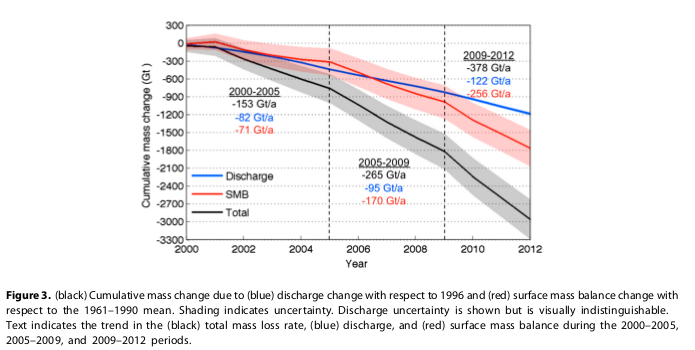
These factors affect Greenland and Antarctica to different extents. In
Greenland surface melt has started to dominate over the last few years,
as Enderlin et al. show in Enderlin(2014), "An improved mass budget for
the Greenland ice sheet," Geophys. Res. Lett., 41, 2014,
doi:10.1002/2013GL059010
The result is an addition of water to the world oceans, which raises sea level. The rate of increase of mass waste from the two major ice sheets is therefore a question of great importance, for while we might easily deal with a small rate of sea level rise, we would face more and more difficulty as that rate increased.
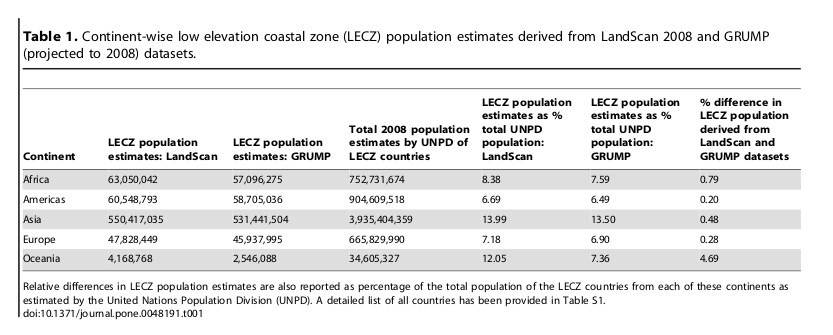
We may look to the past for some answers. At the end of the last ice age, the ice sheets retreated and sea level rose. One of these episodes of ice melt accelated SLR is called Melt Water Pulse 1A (MWP1A), which occurred about fourteen millennia ago, featured a twenty meter (sixty foot) rise in a total period of two to five centuries. Even at the slower estimate, this is a sea level rise of 1 meter (3 feet) every twenty five years, or more than a foot a decade. The faster estimate is one meter (three feet) a decade. Both of these rates of SLR would drown coasts worldwide with horrific consequences.The population of low elevation (under 10 meters) coastal zones is around 700 million souls, all of whom would be drowned or displaced within a century or two. The following graph is from Mondal and Tatem( 2012), Uncertainties in Measuring Populations Potentially Impacted by Sea Level Rise and Coastal Flooding. PLoS ONE 7(10):e48191. doi:10.1371/journal.pone.0048191
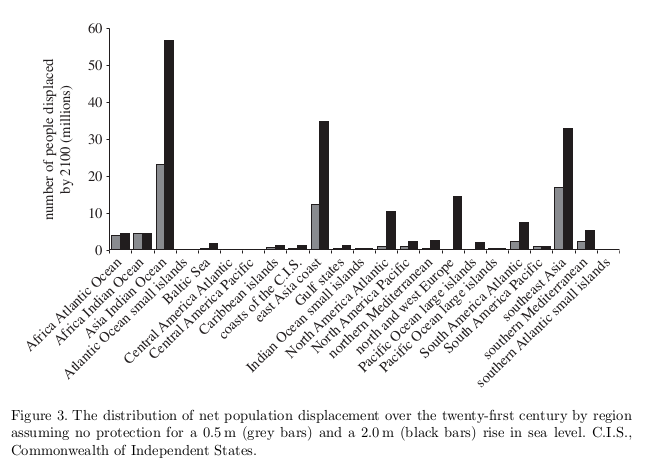
Even a meter of sea level rise would affect about 180 million people. Here is a graph from Nichols et al., "Sea-level rise and its possible impacts given a 'beyond 4°C world' in the twenty-first century", Phil. Trans. R. Soc. A 2011 369, doi: 10.1098/rsta.2010.0291
Current projections of the fate of these two icesheets are uncertain. Projections using linear, semi-empirical models project a range of 0.5 to 2 meters by 2100. These do not and cannot take into account nonlinear processes destabilizing the ice sheets.
Some more posts on Greenland are linked from here and new bedrock maps here