Fig. 14
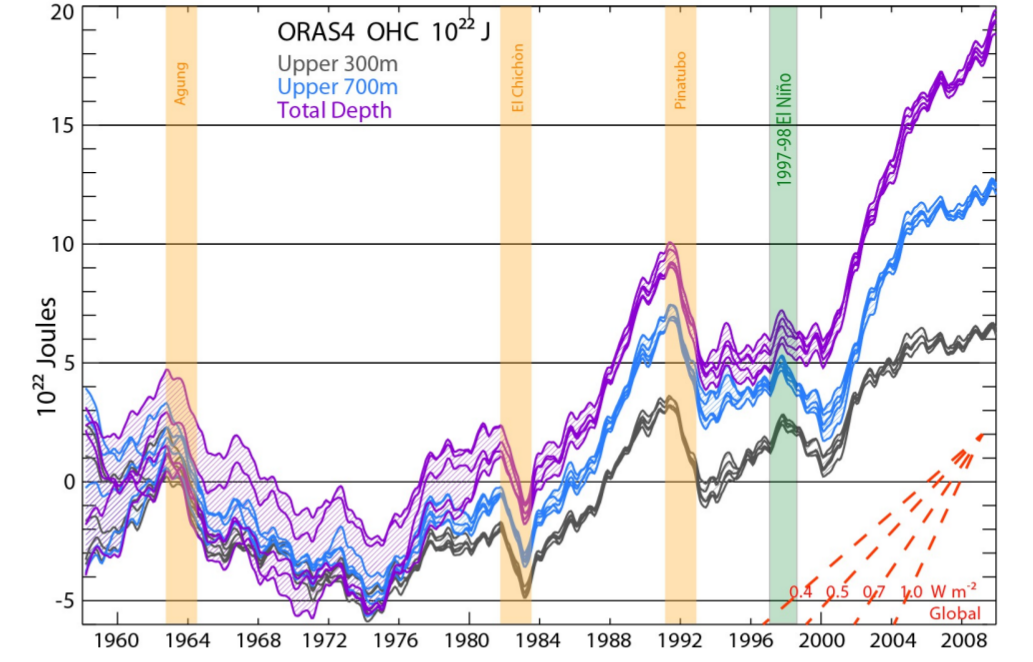
This graph shows the ocean heat content in upto different depths as a function of time.
I wanted to know how much went in different layers since 2000. So I differenced the graph, et viola (a large violin...)
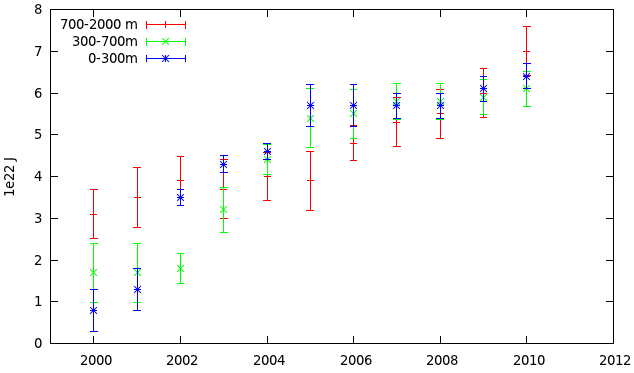
to get the heat into different layers. Looks like 0-300,300-700m warmed from 2000-2006 and 2006-2010 sees 700-2000m warming.
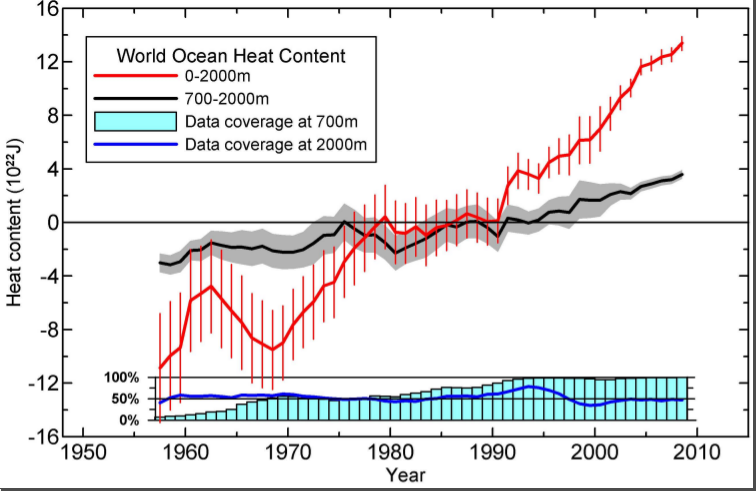
For comparison, I include Levitus(2012) OHC
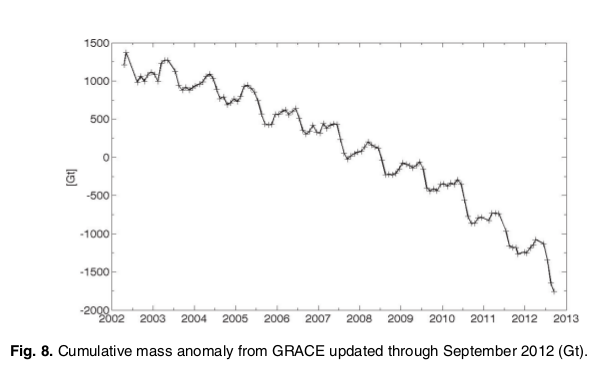
Now I wonder whats going on below 2000m ...
So on to deeper(sorry) matters. Kouketsu(doi:10.1029/2010JC006464, 2011) give 1e22J/yr from 1990s to 2000s for full ocean, 0.8e21J/yr below 3000m, 0.4e21J/yr below 4000m .
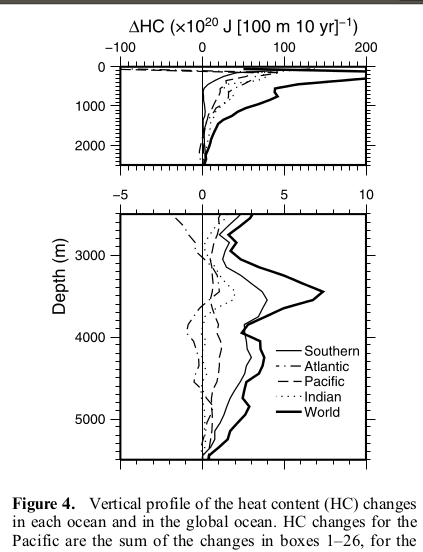
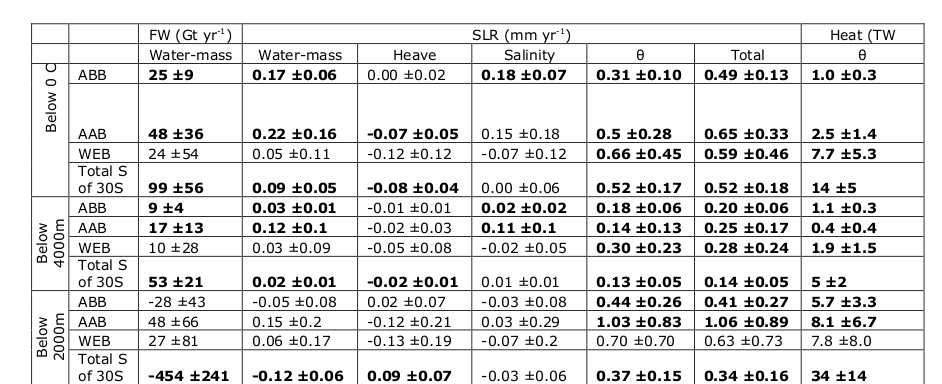
Purkey(doi: 10.1175/JCLI-D-12-00834.1, 2013) say 14% (33Tw+/-14Tw) south of 30S latitude below 2000 m.
 Deep ocean is a player, moves faster than we suppose, the Kraken stirs.
Some approximations:

If all the ice were land based, this would correspond to a sea level rise and fall of 60 mm annually. This is suspiciously close to the net yearly radiative imbalance ... and I see that http://psc.apl.washington.edu/wordpress/research/projects/arctic-sea-ice-volume-anomaly/ agrees approximately.
Here's what Byron had to say
"Until the latter fire shall heat the deep..."
Below the thunders of the upper deep,
Far, far beneath in the abysmal sea,
His ancient, dreamless, uninvaded sleep
The Kraken sleepeth: faintest sunlights flee
About his shadowy sides; above him swell
Huge sponges of millennial growth and height;
And far away into the sickly light,
From many a wondrous and secret cell
Unnumber'd and enormous polypi
Winnow with giant arms the lumbering green.
There hath he lain for ages, and will lie
Battening upon huge sea-worms in his sleep,
Until the latter fire shall heat the deep;
Then once by man and angels to be seen,
In roaring he shall rise and on the surface die.